Mid Cap Equities: It’s Time to Pay Attention

Why Mid Caps?
- We believe Mid Cap companies are uniquely positioned between Large and Small Caps in terms of stability and growth prospects
- A relatively small amount of all Mid Cap companies (by market value) are owned by active managers in the institutional space
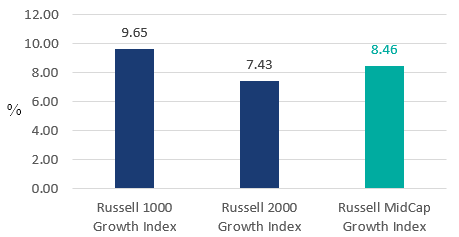
- Mid Cap equities have historically provided very competitive trailing returns relative to both Large Caps and Small Caps over the past 25 years. (Please refer to bar chart)
Why Loomis Sayles?
- Access to an investment team that has been successfully managing small cap growth and small/mid cap growth assets for over 20+ years
- A consistent and repeatable investment process instituted across three investment products
- Ample capacity for up to $10b in Mid Cap Growth assets
We think mid cap is an attractive place to invest
- Mid Cap Growth companies historically have stronger Returns on Equity vs their Small Cap Growth peers
(Russell 2000 Growth Index), yet are less expensive on a Price/Sales ratio vs their Large Cap Growth peers (Russell 1000 Growth Index), while offering a comparable return
PRICE/SALES VS RETURN ON EQUITY
(EQUALLY WEIGHTED, 2001-2025)
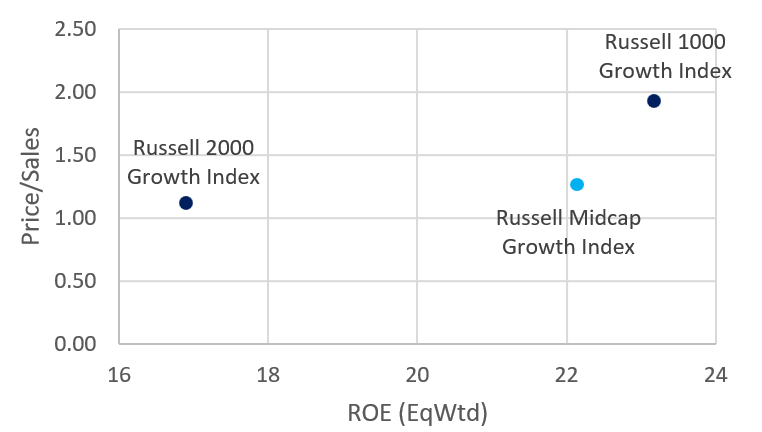
Source: eVestment Alliance. Data from 1/1/2001-12/31/2025
Indices are unmanaged and do not incur fees. It is not possible to invest directly in an index.
Past performance is no guarantee of future results.
- Relative to their size, we have observed that Mid Cap companies have distinctly offered stability in terms of revenue fluctuations as compared to Small Caps, while being more nimble in adapting to changing business environments compared to Large Caps
- In our opinion, this attractive combination of both relative valuation and returns on equity, along with its positioning between its Large Cap and Small Cap growth peers, are important factors that have led to greater returns over the past 25 years, as shown below:
HISTORICAL ANNUALIZED RETURNS (2001-2025)
as of 12/31/2025
MID CAP HAS HISTORICALLY SHOWN MORE FAVORABLE UPSIDE/DOWNSIDE MARKET CAPTURE COMBINATION
- Mid Cap equities historically have generated a more favorable upside/downside market capture trade-off than both Large Caps and Small Caps vs the broader Russell 3000 Index
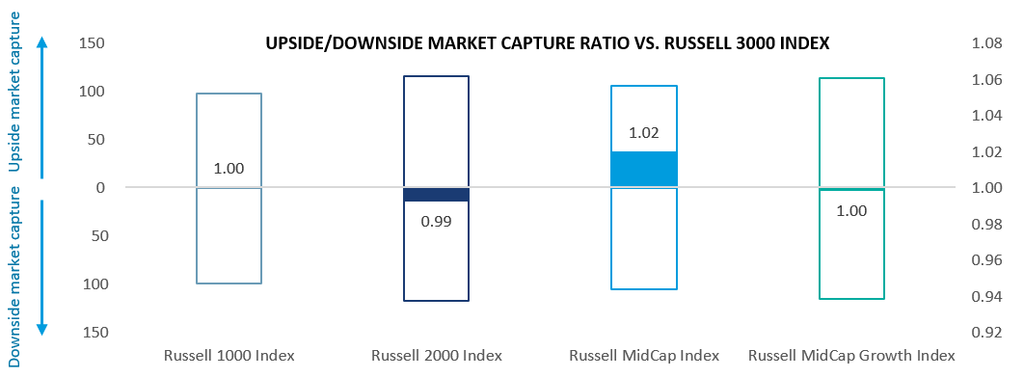
Source: eVestment Alliance, Data from 1/1/2001-12/31/2025. The Russell 3000 Index (entire US stock market)
HISTORICALLY CONSISTENT OUTPERFORMANCE OVER THE LONG TERM
- Mid Caps, and particularly Mid Cap Growth equities, have been more consistent overall than both Large Caps and Small Caps in terms of outperforming the broader market over time
- This outperformance by Mid Cap Growth equities also has proven as durable as Large Caps and more resilient than Small Caps with greater outperformance over 5-year periods as compared to 3-year periods, as demonstrated in the tables below
ROLLING 3-YR RETURNS: % PERIODS RUSSELL INDICES HAVE HISTORICALLY OUTPERFORMED THE RUSSELL 3000 INDEX

ROLLING 5-YR RETURNS: % PERIODS RUSSELL INDICES HAVE HISTORICALLY OUTPERFORMED THE RUSSELL 3000 INDEX

Source: eVestment
Rolling 3-Yr no. of occurrences: <0 (10), 0-10% (27), 10-20% (29), >20% (23), Total (89). Rolling 5-yr no. of occurrences: <0 (6), 0-10% (26), 10-20% (29), >20% (20), Total (81)
Indices are unmanaged and do not incur fees. It is not possible to invest directly in an index.
Past performance is no guarantee of future results.
DESPITE GREATER HISTORICAL RETURNS, WE BELIEVE THERE IS A RELATIVE UNDERALLOCATION TO MID CAP STRATEGIES
- Only 5% of all Mid cap companies by market value are owned by active Mid cap managers in the institutional space
- Relative to both Large cap and Small cap, we believe this under allocation presents a compelling opportunity for active managers in the Mid cap space.
PERCENTAGE OF TOTAL AVAILABLE MARKET WITHIN EACH BENCHMARK OWNED BY ACTIVE MANAGERS
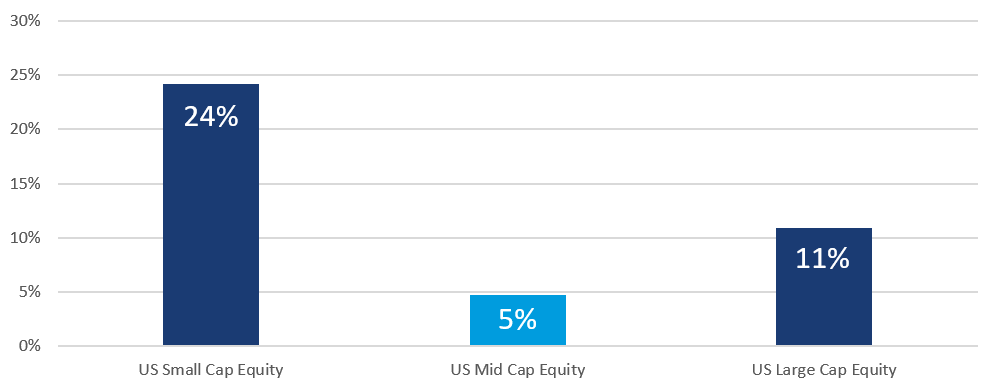
Source: eVestment Alliance, Factset; columns represent total market cap of all securities listed in the Russell 1000 Index (US Large Cap Equity), Russell 2000 Index (US Small Cap Equity), Russell Mid Cap Index (US Mid Cap Equity)
CHOOSING THE RIGHT MANAGER HAS BEEN CRITICAL TO LONG-TERM SUCCESS IN THE SPACE
- Historically, it has been difficult for active Mid Cap Growth managers to consistently outperform the index
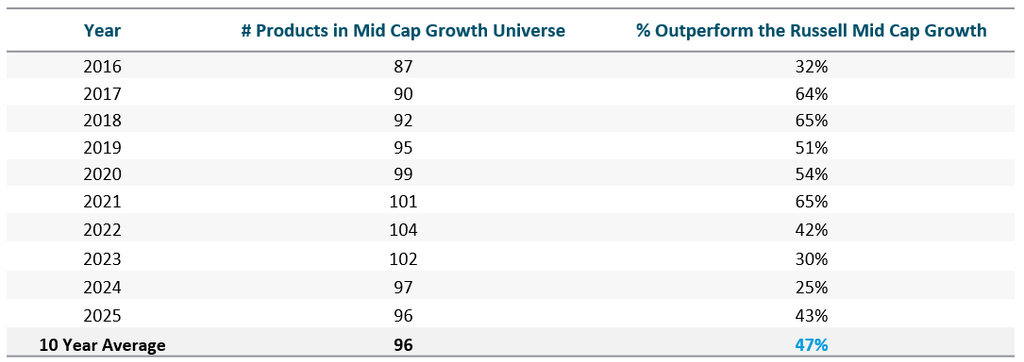
Source: eVestment Alliance US Mid Cap Growth universe.
Indices are unmanaged and do not incur fees. It is not possible to invest directly in an index.
Past performance is no guarantee of future results.
Team Highlights
Investment Team has been successfully managing Small Cap Growth assets since 4/2005 and Small/Mid Cap Growth assets since 1/2012
Total Team Assets: $5.4 B as of 12/31/2025
Mid Cap Growth
COMPOSITE INCEPTION: 1/1/2020
BENCHMARK: Russel Midcap Growth
# HOLDINGS: 45-55
Investment Philosophy
WEALTH IS CREATED THROUGH THE POWER OF LONG-TERM COMPOUNDING OF CONSISTENT RETURNS
- Consistent returns are more likely to be generated by a disciplined and repeatable investment process
- Companies with quality business models and secular growth opportunities tend to help generate more consistent returns
- High quality companies whose stocks possess lower share turnover tend to be less exploited and less volatile
- Consistent returns require a comprehensive, active risk management approach
Process Differentiators
OUR GOAL IS A LOWER VOLATILITY APPROACH TO HIGH GROWTH INVESTING
- Idea generation methodologies that help target undiscovered secular growth stocks
- Valuation analysis incorporates discounted cash flow modeling to help compare and better understand risk/reward
- Active risk management approach includes a sell strategy incorporating a clear stop loss discipline
Key Risks
Equity Risk, Market Risk, Non-US Securities Risk, Liquidity Risk. Investing involves risk including possible loss of principal.
Glossary
Sharpe Ratio: measurement of efficiency utilizing the relationship between annualized risk-free return and annualized standard deviation. This statistic is computed by subtracting the return of the risk-free index (typically 91-day T-bill or other cash benchmark) from the return of the manager to determine the risk-adjusted excess return. This excess return is then divided by the standard deviation of the manager. The higher the Sharpe Ratio, the greater efficiency produced by the manager.
Average Drawdown: The arithmetic average of all drawdowns (peak-to-trough declines) over a given time period.
Sortino Ratio: similar to the Sharpe Ratio except that it is concerned only with downside volatility (unfavorable) versus total volatility (both favorable, upside volatility and unfavorable, downward volatility). This statistic is computed by subtracting the return of the risk-free index (typically 91-day T-bill or other cash index) from the return of the manager to determine the risk-adjusted excess return. This excess return is then divided by the downside risk of the manager. The higher the Sortino Ratio, the better.
Upside Market Capture: A measure of the manager’s performance in up markets relative to the market itself. The Upside Capture Ratio is calculated by dividing the return of the manager during the up market periods by the return of the market for the same period. Generally, the higher the UMC Ratio, the better.
Downside Market Capture: A measure of the manager’s performance in down markets relative to the market itself. The Downside Capture Ratio is calculated by dividing the return of the manager during the down-market periods by the return of the market during the same periods. Generally, the lower the DMC Ratio, the better.
Batting Average: A measure of the frequency of success. This ratio is calculated by taking the number of periods where the man ager equals or outperforms the selected benchmark, divided by the total number of periods. A batting average of 50% is considered a minimum threshold for success.
Russell 2000 Growth Index: The Russell 2000 Growth Index tracks the performance of publicly traded small-cap companies in the United States with higher price-to-book ratios and higher forecasted growth values.
Russell 1000 Growth Index: The Russell 1000 Growth Index tracks the performance of publicly traded large-cap companies in the United States with higher price-to-book ratios and higher forecasted growth values.
Russell Midcap Growth Index: The Russell Midcap Growth Index tracks the performance of publicly traded mid-cap companies in the United States with higher price-to-book ratios and higher forecasted growth values.
Russell 1000 Index: The Russell 1000 Index tracks the performance of 1,000 publicly traded large-cap companies in the United States.
Russell 2000 Index: The Russell 2000 Index tracks the performance of approximately 2,000 publicly traded small-cap companies in the United States.
Russell MidCap Index: The Russell Midcap Index tracks the performance of approximately 800 publicly traded mid-cap companies in the United States.
Important Disclosure:
This marketing communication is provided for informational purposes only and should not be construed as investment advice. Any opinions or forecasts contained herein reflect the subjective judgments and assumptions of the authors only and do not necessarily reflect the views of Loomis, Sayles & Company, L.P. Investment recommendations may be inconsistent with these opinions. There can be no assurance that developments will transpire as forecasted and actual results will be different. Data and analysis does not represent expected future performance of any investment product. We believe the information, including that obtained from outside sources, to be correct, but we cannot guarantee its accuracy. Accuracy of data is not guaranteed but represents our best judgment and can be derived from a variety of sources. Opinions are subject to change at any time without notice.
This material is not intended to provide tax, legal, insurance, or investment advice. Please seek appropriate professional expertise for your needs.
Tracking error is a range and the strategy may not always be able to remain within it.
Market conditions are extremely fluid and change frequently.
There is no guarantee that the investment objective will be realized or that the strategy will generate positive or excess return.
Any investment that has the possibility for profits also has the possibility of losses, including the loss of principal.
Diversification does not ensure a profit or guarantee against a loss.
Past performance is no guarantee of future results.
For additional information, please request a full presentation book for the Loomis Sayles Mid Cap Growth Composite.
8968663.1.2
Meet the Team